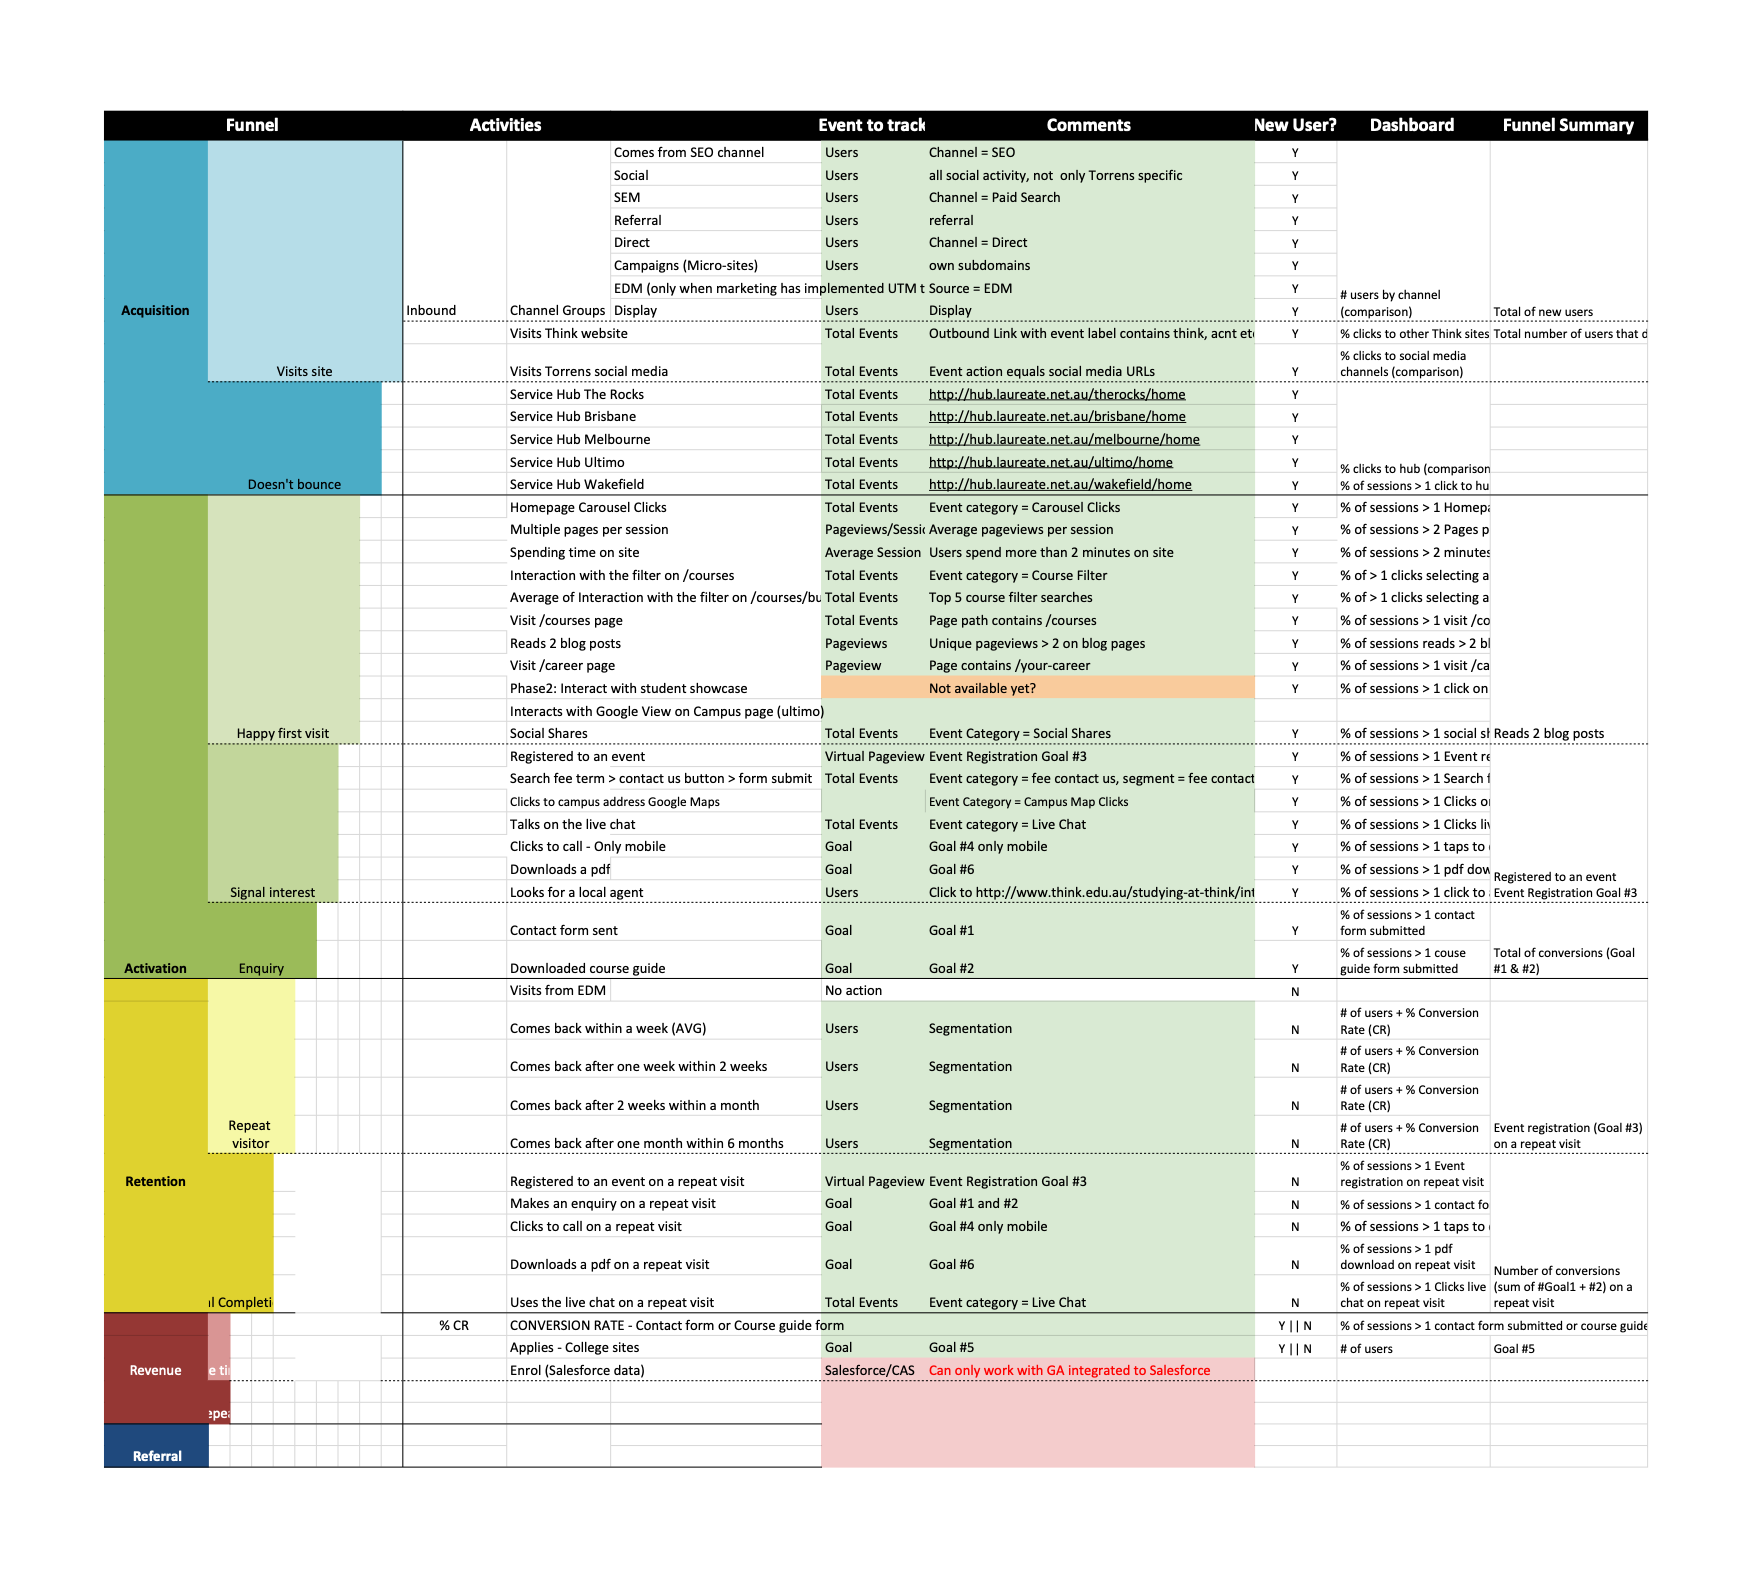
To get a clearer picture of where in the process potential new students are dropping off on our Multisite framework, we created a user funnel with the help of AARRR.
AARRR, a framework originally developed by Dave McClure, stands for Acquisition, Activation, Retention, Revenue and Referral. They are the stages that a customer (ideally) goes through. Although I’ve seen some people add another A for awareness to the start of the list.
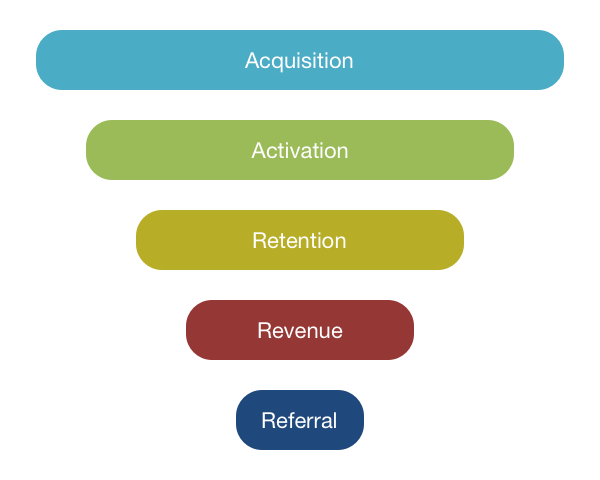
It starts with Acquisition, the acquiring of potential customers into the digital worlds that you control; your websites and social media pages. The total number is everyone who arrived from everywhere.
Acquisition is followed by Activation. Which of those who were acquired, performed some sort of action that indicated some form of interest in what you’re offering?
Especially big purchases are rarely made on the spot. Retention measures those who came back at a later stage to continue their journey.
When finally a purchase has been made, it is counted as Revenue.
And what better way is there to increase awareness of your product when customers tell their friends about their purchase? This counts as Referral.
The next step for us was to set up specific goals for each of these stages. For example, what exactly do we count as an activation by a user? Reading a blog post? Watching a video? Watching 2 videos?
We started by breaking down the stages into slightly more tangible categories:
Acquisition
- Visits site
- Doesn’t bounce
Activation
- Happy first visit
- Signal interest
- Enquiry
Retention
- Repeat visitor
- Goal completions
Revenue
- One time
- Repeat
Referral
Until we came up with the following table.
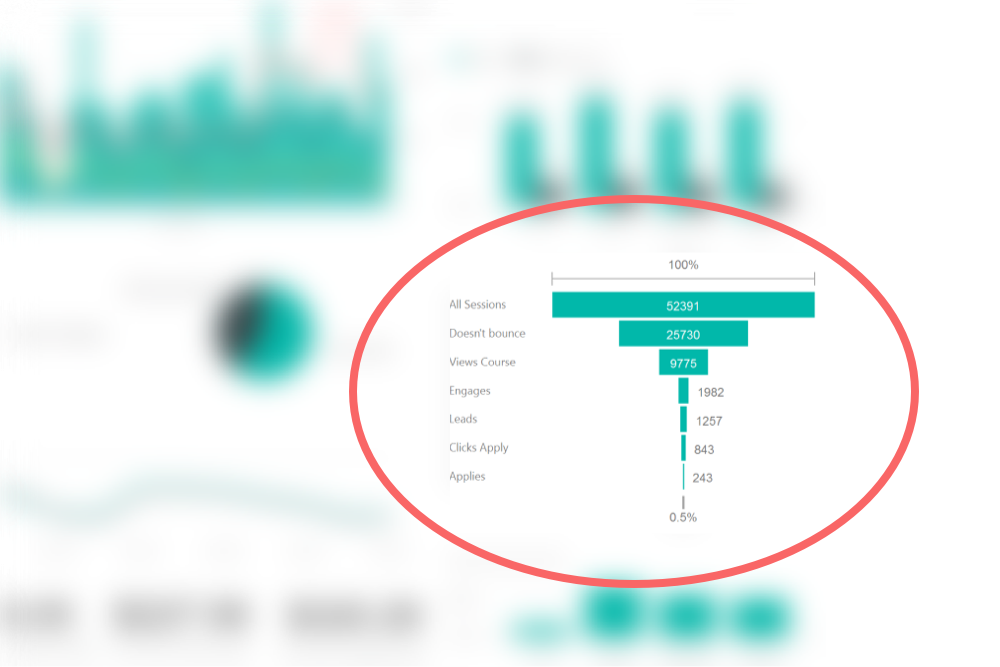
After the goals with their measurements have been defined, they can be tracked on the website and reported on. I used Microsoft Power BI to retrieve data from multiple sources and created a funnel using actual data coming in.

From the funnel in this report, you can see that there is a relatively large drop off between first visitors and those who don’t leave right after (didn’t bounce), which is part of the acquisition phase. Then there is also a gap between those who have viewed at least one course and then decided to engage through anything that we had defined as part of the activation phase. Finally, in the revenue stage there are only 207 people who continued the application process after 736 users had clicked on the apply button, which is less than 30%. So as a designer, I would then focus on how we could increase conversion in those three areas.