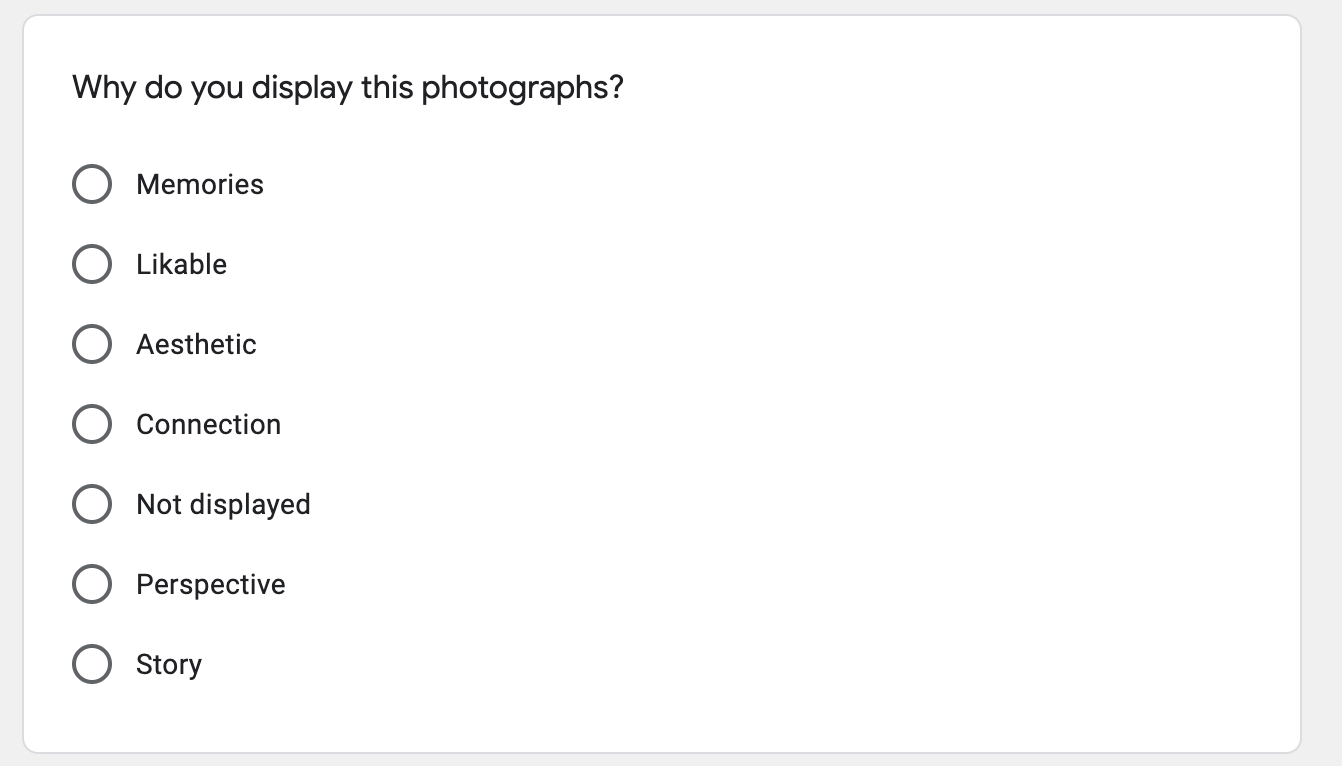
To get a clearer understanding of the wants and needs of the audience of our social venture called Fair Photo, we drafted a questionnaire with several questions about their attitude and behaviours towards print photography.
At the time, we used Google Forms to create online forms that you can then share with as many people as you like and it is free to use.
From the form, the incoming results are automatically inserted into a Google Spreadsheet.
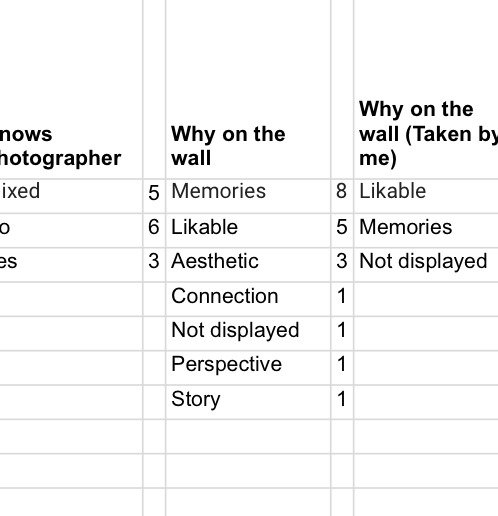
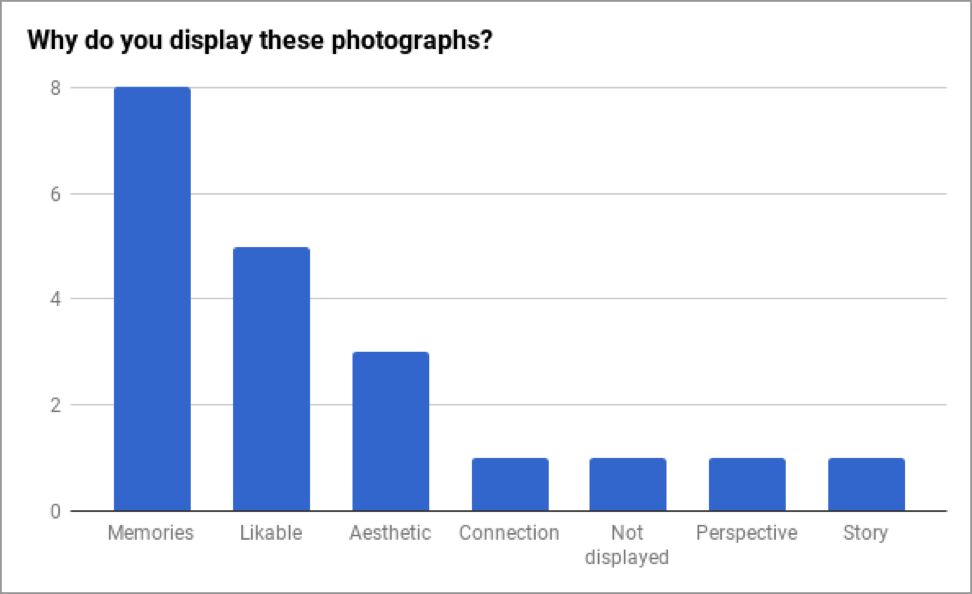
Inside Google Spreadsheets, you can select a certain range of cells and turn it into a graph.
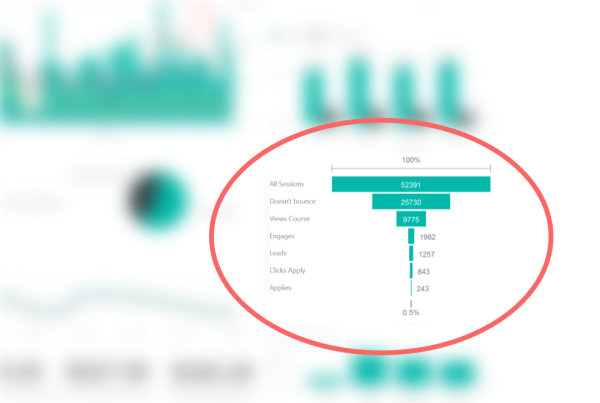
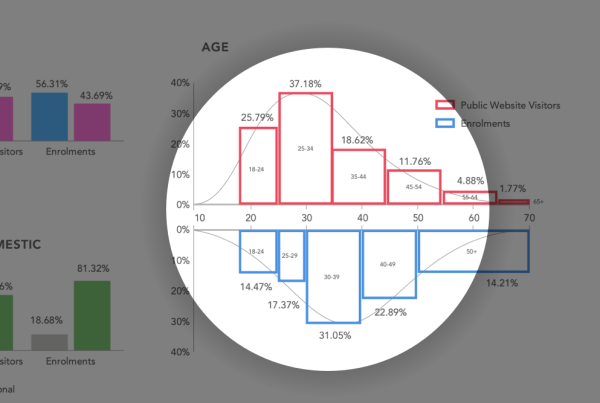
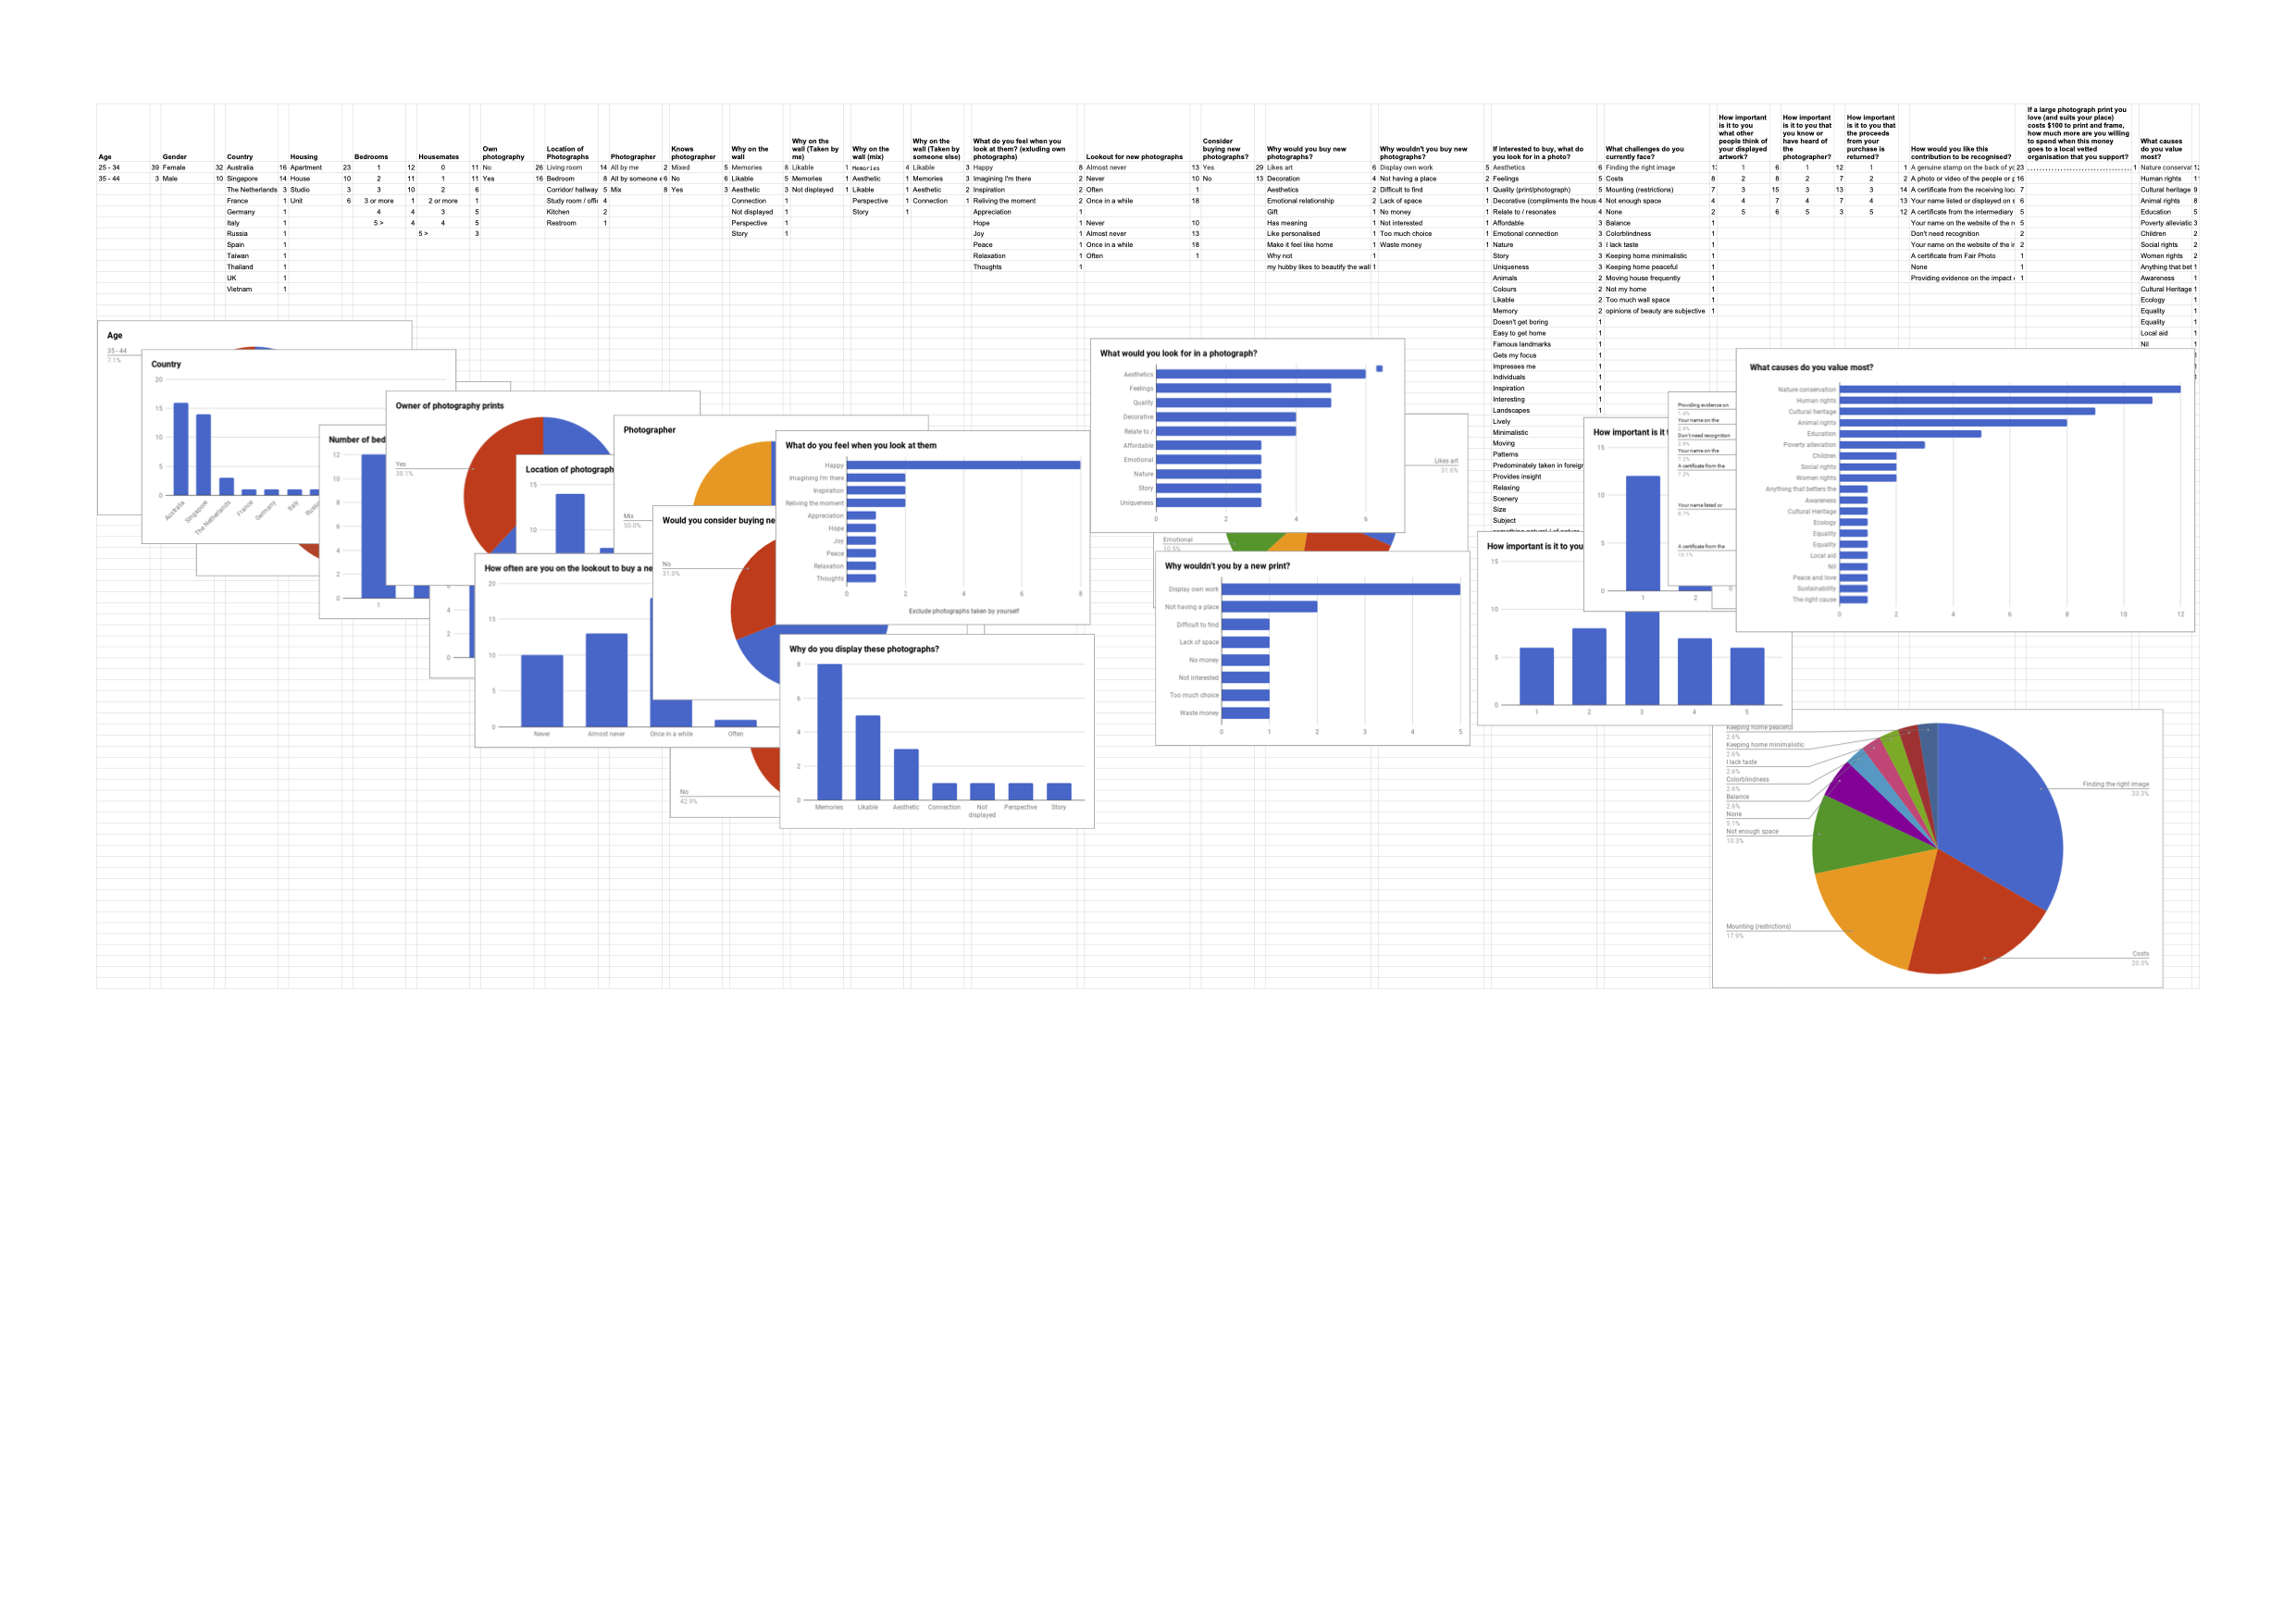
So eventually, the whole spreadsheet looked like this:
Then finally, if you create a new Google Slides project, you can import these Google Spreadsheet graphs while maintaining a link to the spreadsheet file.
This now means that if someone fills out another entry in the online form, this will automatically and immediately be added to the graph in the live research report. All that is needed going forward is to keep an eye on the text to make sure that it still matches the results, but the data will always be as up to date as it can be.
Unfortunately, I’ve lost all Fair Photo Google Drive files such as Google Docs, Google Sheets and Google Slides when I wanted to migrate everything to Dropbox. I was under the impressions that those .gdoc and .gsheets files that are downloaded to your desktop from Google Backup & Sync contained the actual data, turns out they didn’t.
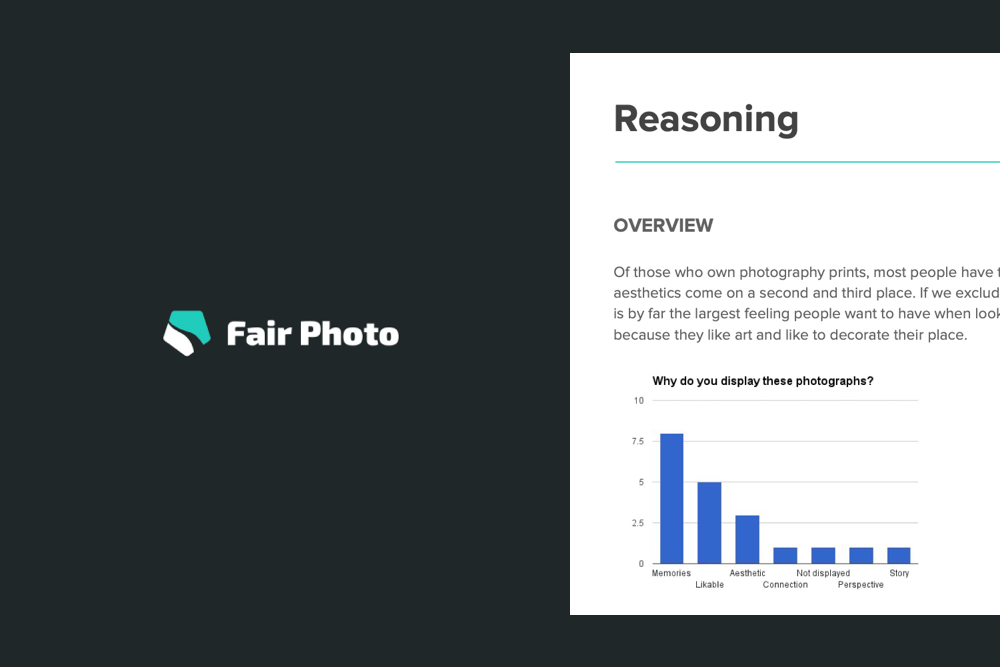
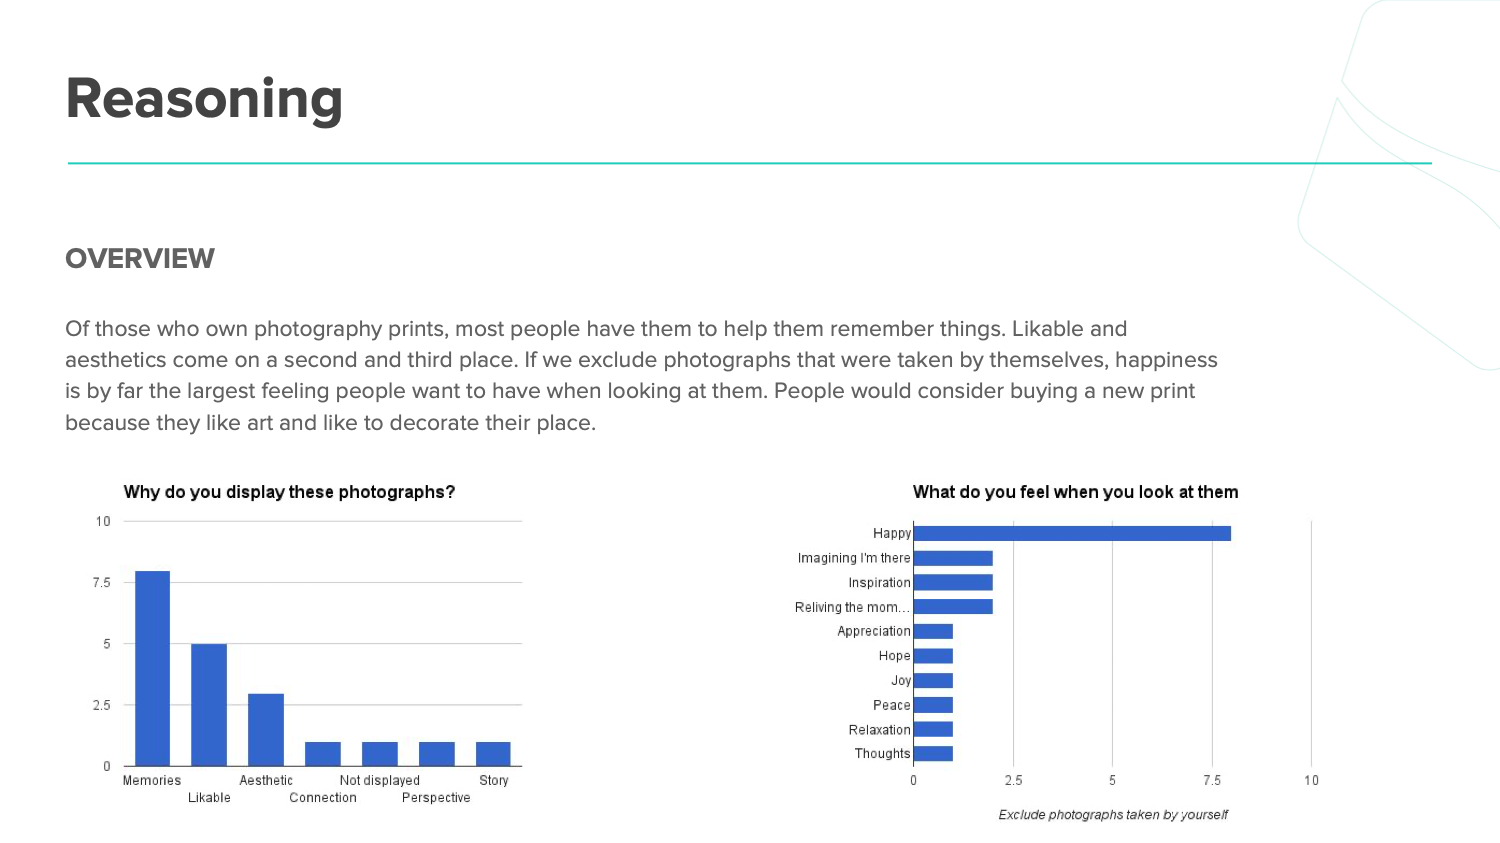
Luckily, here’s a snapshot of the research report in good old pdf.